Accessibility
Creating Accessible Infographics
Last modified 9/26/2025
Infographics combine text, visuals, and data to communicate complex ideas quickly and effectively; however, without accessibility considerations, these designs can present significant barriers for people with disabilities, particularly those with visual and cognitive impairments. Accessible infographics go beyond aesthetics, embracing techniques that make content adaptable for assistive technologies like screen readers and ensuring color contrasts are distinguishable by those with color blindness. By adopting accessible design principles, designers can make infographics not only visually appealing but also inclusive, enhancing communication and understanding for a diverse audience.
PDF Infographics
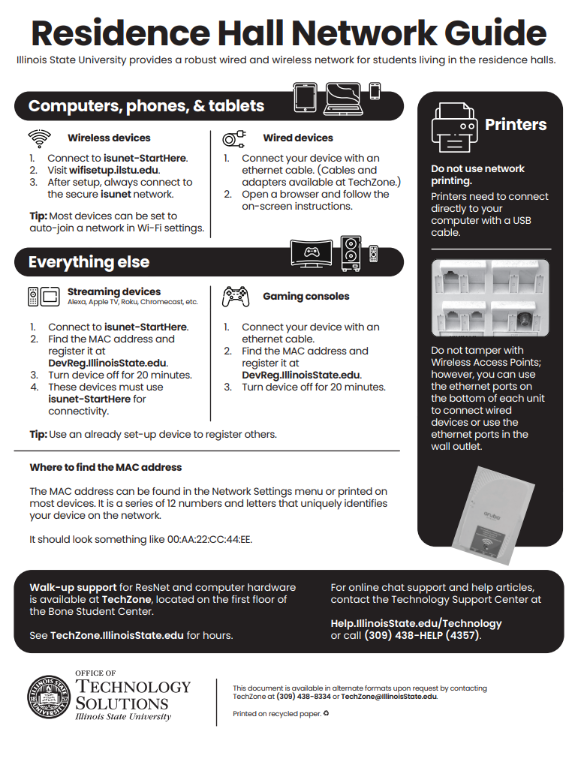
PDF infographics are very popular because they are easy to share on different platforms. But to make sure everyone can use them, including people who rely on screen readers, it’s important to make PDF infographics accessible. With Adobe Acrobat Pro, you can add accessibility features, like tags and structure, to make the infographic readable for screen readers. A PDF infographic can be made accessible if all document accessibility best practices for PDFs are followed.
Illustrated Infographics
Image infographics are widely popular for their visual appeal, but they are also the least accessible format. Since screen readers cannot interpret text within an image, image-based infographics need alternative ways to ensure accessibility. One effective solution is to provide a full-text transcript that includes the infographic’s title, headings, and key data points, making the information accessible to screen reader users. You may be familiar with writing alt text for images, for transcripts, include a clear link before the infographic that houses the full transcript. This link should lead directly to the complete text description, making the infographic accessible to all users.
General Tips for Making Infographics Accessible
1. Use Simple Designs
Keep your infographic clean and straightforward. Avoid excessive visual effects, animations, or complex layouts. A simple design helps convey your message clearly without overwhelming the audience.
2. Optimize Color Contrast
Ensure text and graphics stand out clearly against their backgrounds. Use color contrast checking tools to verify that your design meets accessibility standards, making the content easier to read for all users.
3. Offer Alternative Formats
Provide accessible alternatives such as downloadable data tables or plain text summaries. This ensures that users who may have difficulty with visual content can still access the important information in your infographic.
4. Create Comprehensive Transcriptions
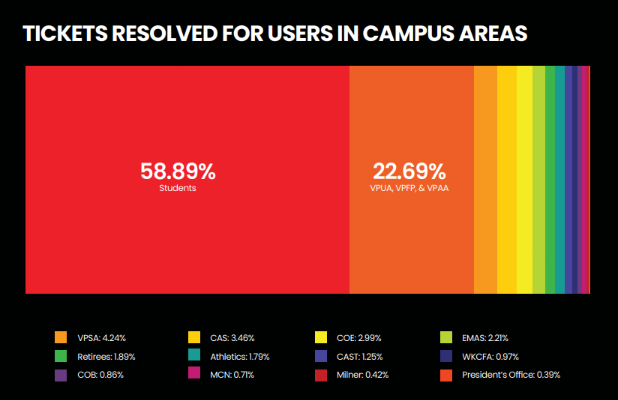
Develop a written transcript that accurately reflects the information and experience provided by the infographic. Explain visual elements used for impact, such as color-coding for different demographics, to ensure all users can draw the same conclusions from the data.
5. Implement Descriptive Alt Text
Include concise yet informative alt text for all images and graphs within your infographic. This allows users with visual impairments to understand the significance of the visual content through screen readers.
6. Choose Appropriate Fonts
Select easily readable fonts and use appropriate font sizes, especially considering smaller screens. Avoid tiny text to ensure your infographic is legible for all users.
7. Structure Information Logically
Organize your content in a clear, logical manner. Use headings and subheadings to create a hierarchical structure that aids in understanding the flow of information.
By following these guidelines and best practices, you can create infographics that are inclusive and accessible to a diverse audience. Prioritizing accessibility allows you to communicate your message more effectively, ensuring that everyone, regardless of their abilities, can engage with your content. Embracing these principles fosters a more welcoming environment for all users, enhancing their experience and understanding of the information you wish to share.
Resources
Feedback
To suggest an update to this article, ISU students, faculty, and staff should submit an Update Knowledge/Help Article request and all others should use the Get IT Help form.

